06 / 06
Universidade da Madeira: precision irrigation
Agricultural IoT · Decision support
A data-driven irrigation platform for experimental vineyards — turning climate, soil and plant data into actionable irrigation times.
Context
Madeira is a hard place to manage agricultural water: altitude, slope, exposure and microclimate mean two nearby vineyards can have very different needs. Traditional irrigation runs on fixed schedules and operator experience — without knowing how much water the crop lost, what remains in the soil, whether rainfall changed the requirement, or whether the plants are already stressed. For a university running experiments, the data problem compounds: measurements dispersed across devices, recorded manually, hard to compare.
The product challenge was a deceptively simple question: how much water does each crop need, and how long should the irrigation run to provide it?
My responsibility
I led the development of the precision-agriculture solution for Universidade da Madeira and managed it as one integrated product — sensors, power, communications, data models, agronomic logic and the physical irrigation infrastructure, not just a digital interface.
I translated research, agronomic and technical requirements into product capabilities, introduced the automatic ET₀ and crop-coefficient calculations, defined the irrigation-time recommendation workflow, and coordinated researchers, agronomists, field operators, hardware suppliers and developers.
Constraints
- Remote plots with no mains power or fixed communications — solar-powered field nodes, batteries, 4G links and edge data-logging to survive outages.
- A research environment: plots intentionally follow different irrigation strategies, so the system could not enforce a single automation policy.
- Complex agronomic variables, but the platform had to stay understandable — scientific value without overwhelming users.
Decisions
- Multiple sources of truth: weather estimates demand, soil sensors measure available water, dendrometers and plant water-status sensors measure the response, water meters verify what was actually applied.
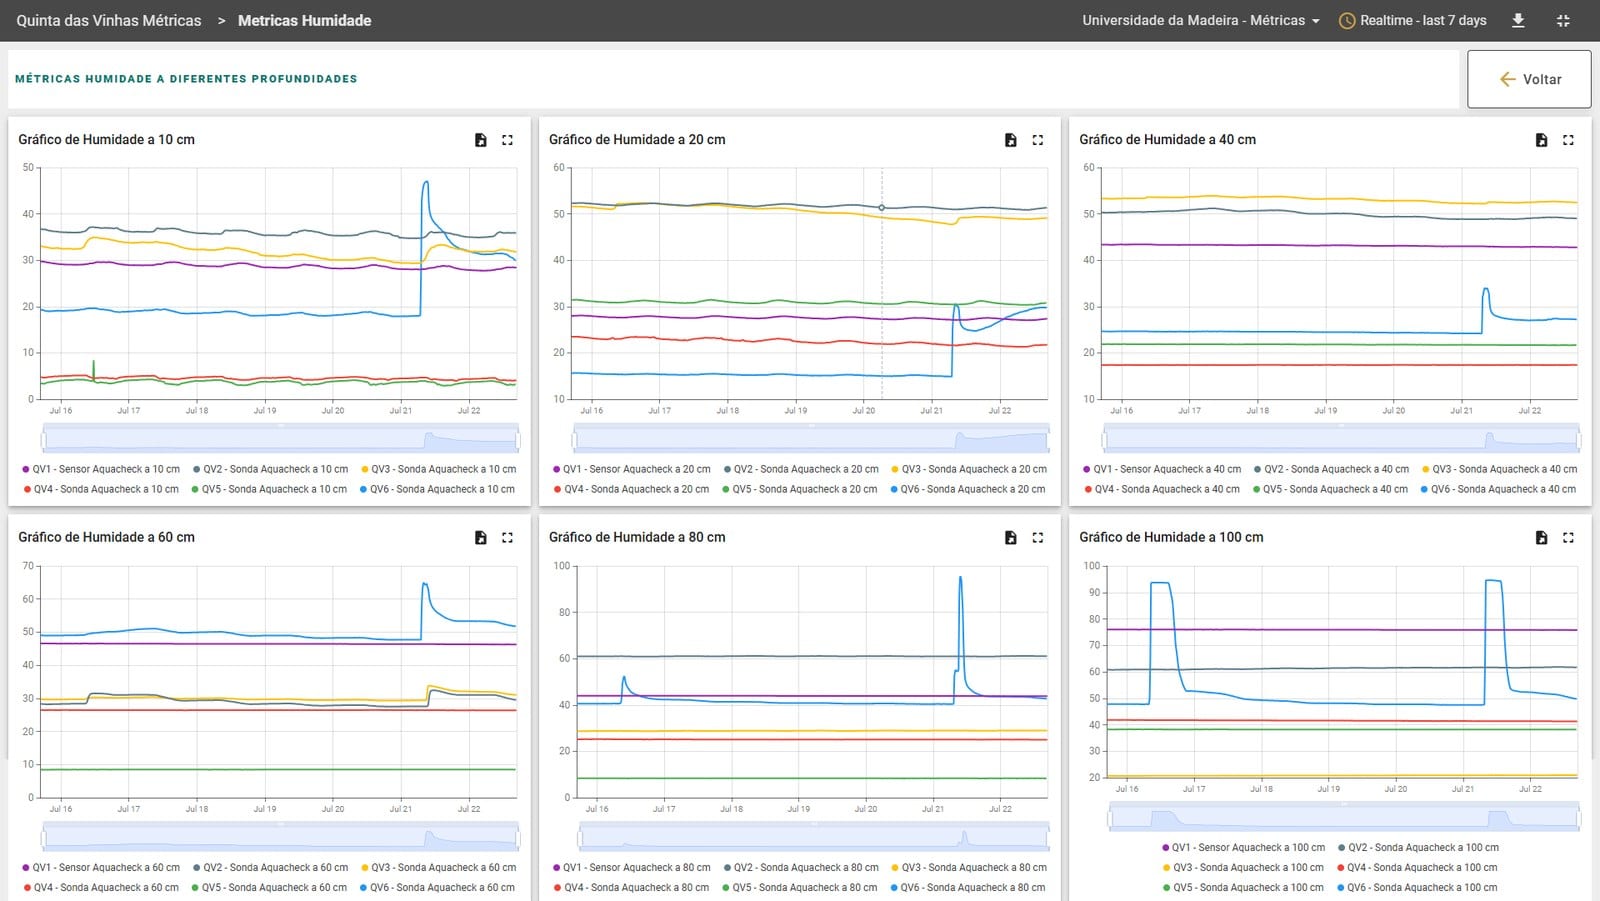
- Monitor the full root zone at multiple depths — a single surface reading misleads in both directions.
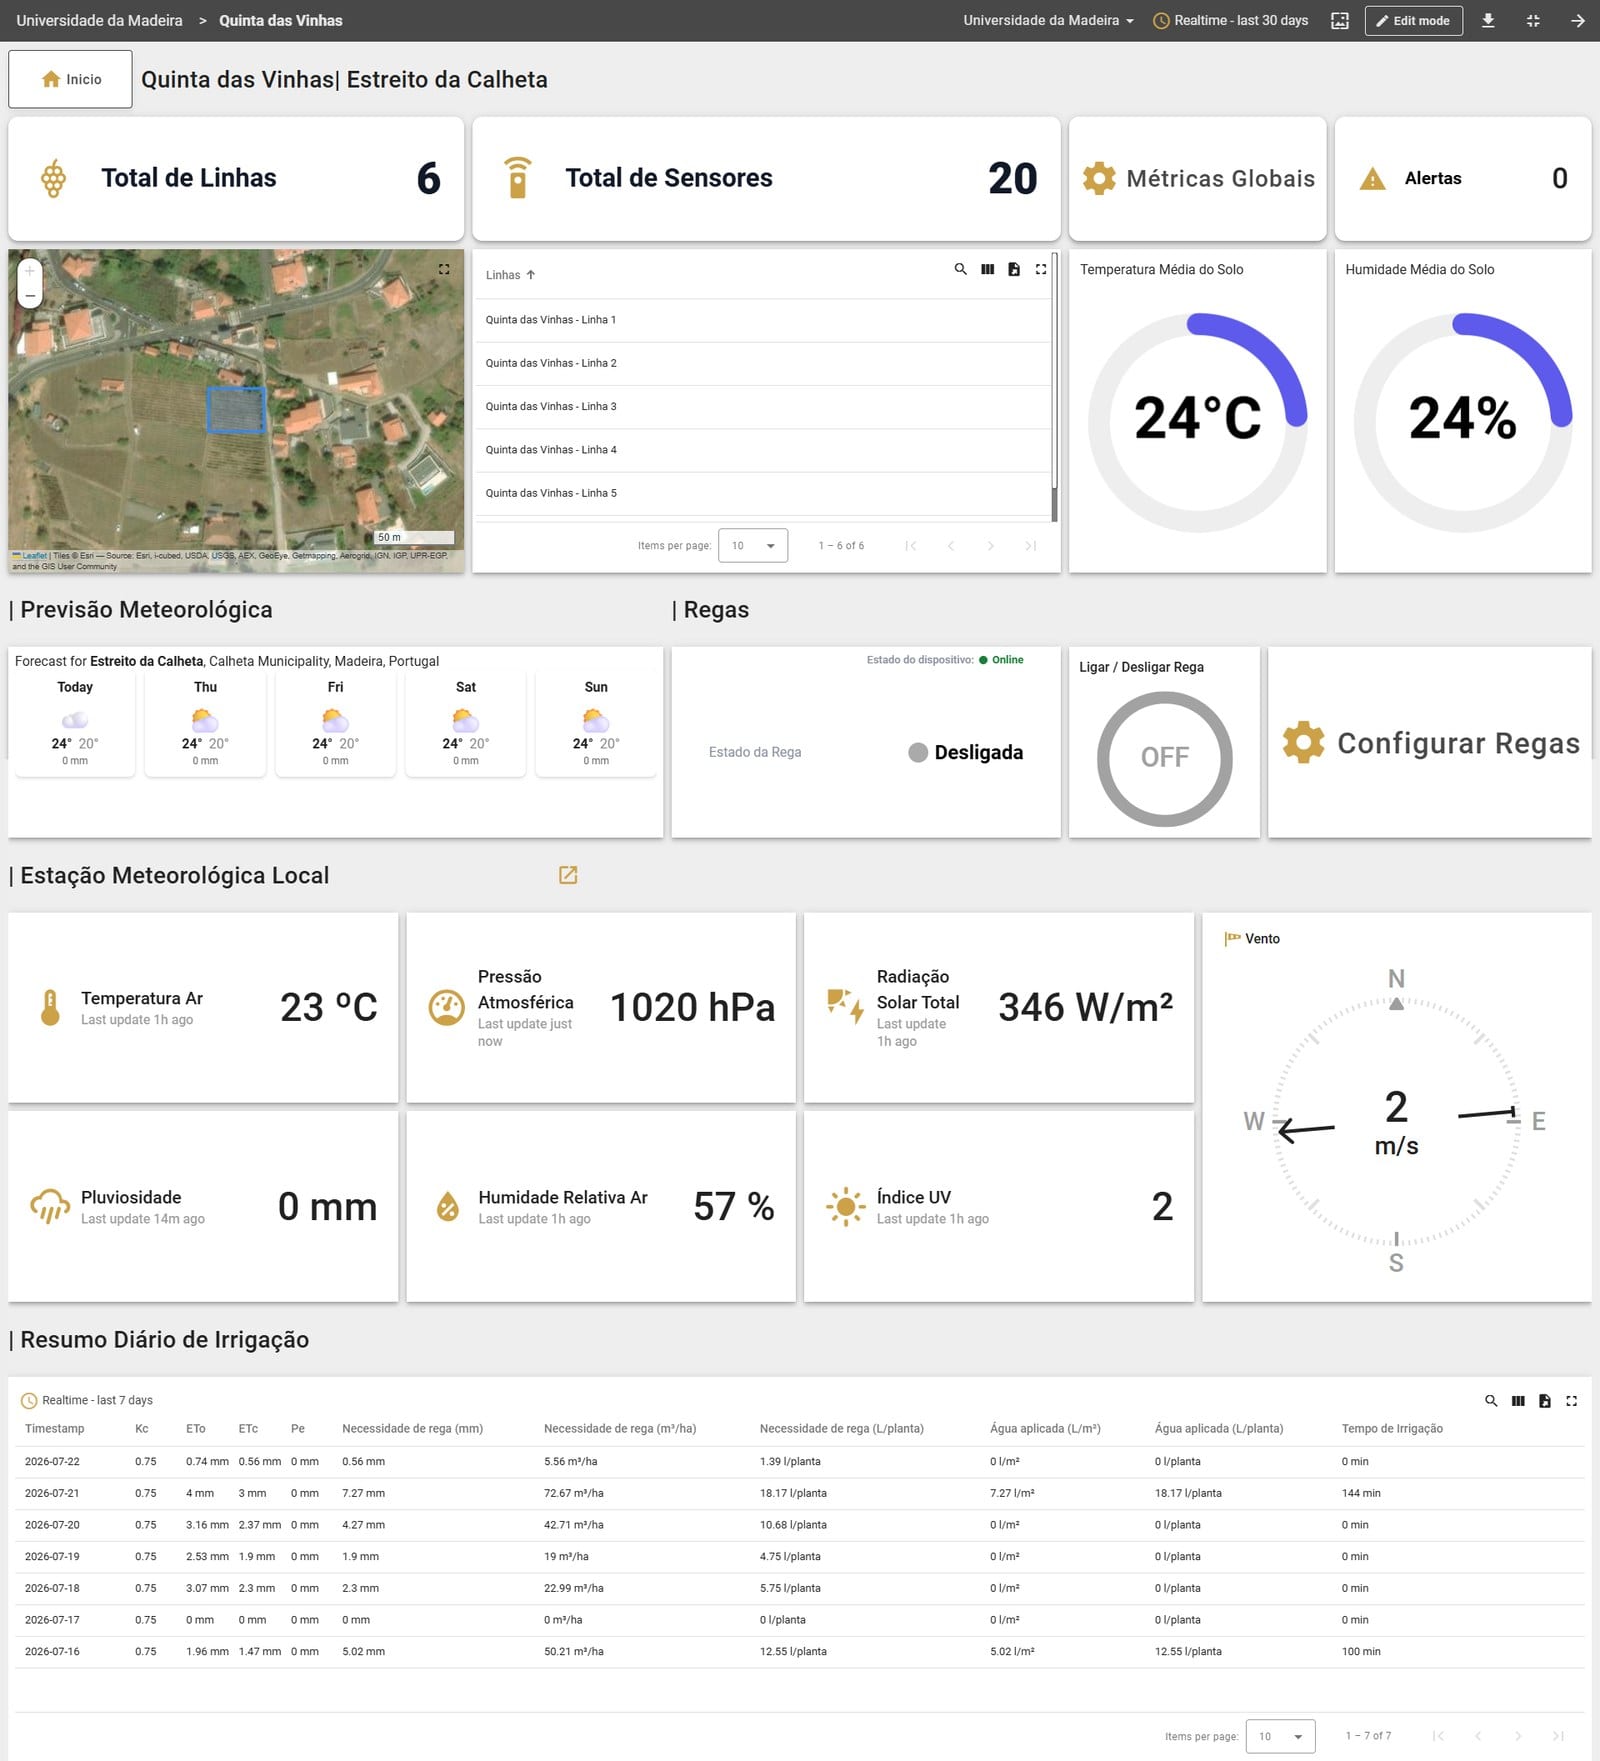
- Convert agronomy into action: ETc = ET₀ × Kc, then rainfall, soil moisture, area, flow rate and efficiency — down to minutes of irrigation per zone.
- Structure the product as decision support, not monitoring: measure → contextualise → calculate → recommend → act → verify.
- Keep humans in control — researchers review calculations, adapt crop coefficients, schedule or override irrigation.
- Design modularly, so plots, crops and sensors can be added without redesigning the platform.
What shipped
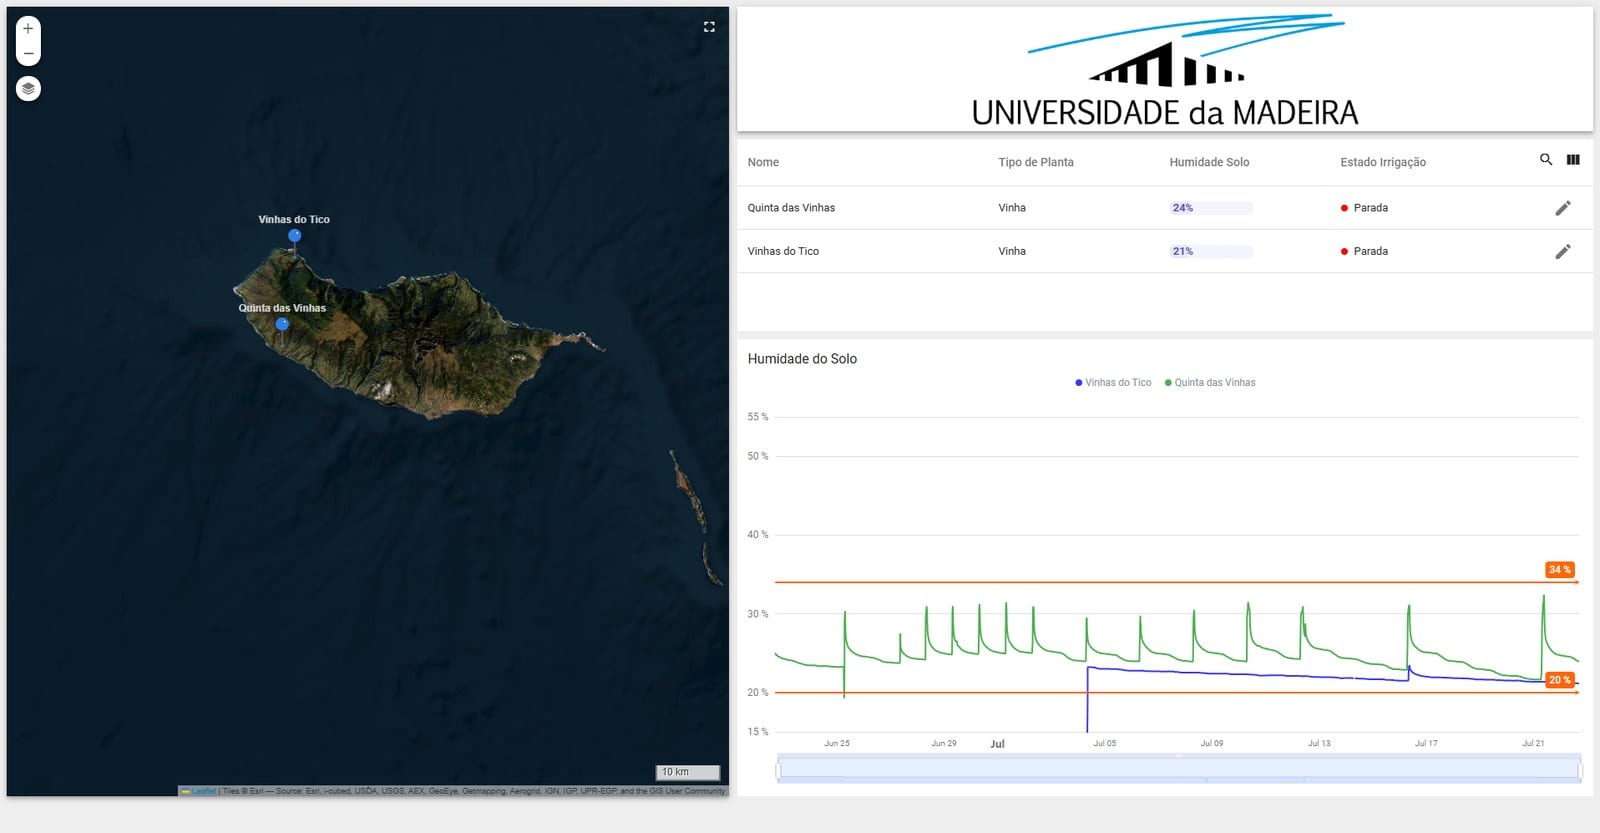
Two experimental vineyards, twelve monitored plots, five connected layers:
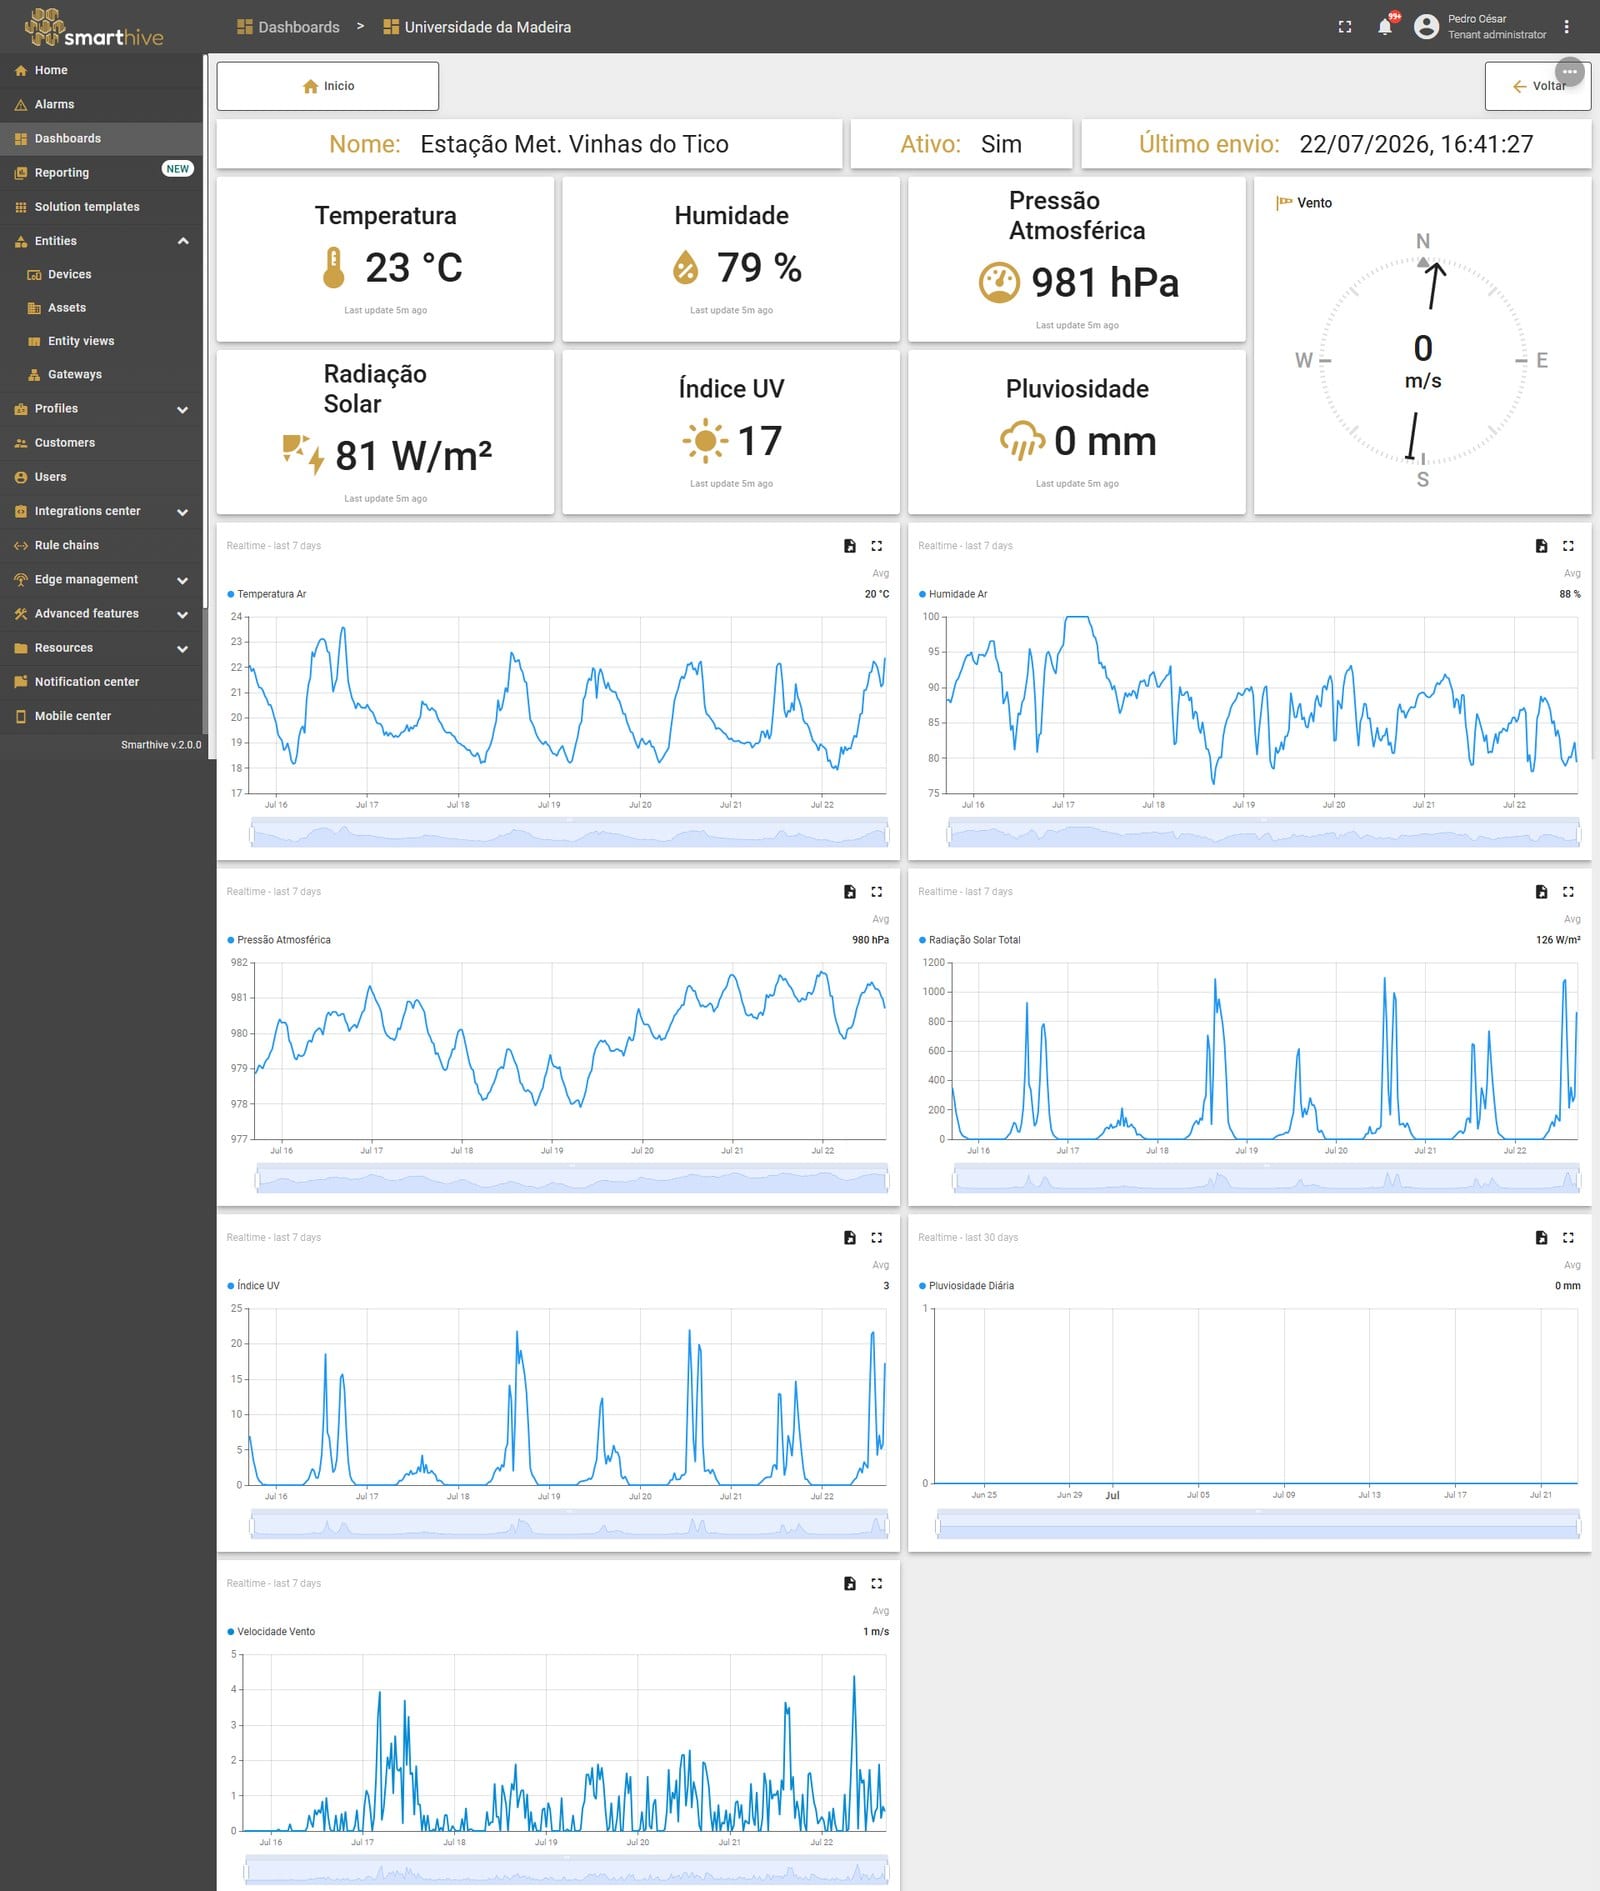
- A professional agroclimatic station — temperature, humidity, precipitation, solar radiation, wind and leaf wetness
- Multi-depth soil monitoring through the root zone — moisture, temperature and electrical conductivity
- Plant monitoring — dendrometers and plant water-status sensors
- Remote irrigation control per zone, with pulse water meters verifying the delivered volume
- Automatic ET₀, ETc and recommended irrigation-time calculations
- Smarthive dashboards — plot comparison, historical analysis and threshold-based alerts
- Solar-powered field nodes with 4G connectivity and edge data-logging
Evidence and outcomes
The platform closes a decision-support loop: understand the crop's water demand, apply the appropriate quantity, verify the result. Irrigation follows actual field conditions instead of fixed schedules — no watering after sufficient rainfall, no running longer than the crop needs, no losses below the root zone.
For the university, synchronised timelines of weather, soil, plant and irrigation data make experiments repeatable and deficit-irrigation strategies comparable — and build a long-term dataset of local crop coefficients, vineyard water requirements and plant stress responses.
Reflection
This was product management across a full system rather than a purely digital interface — every user-facing capability depended on decisions about sensors, power, communications, data models, agronomic logic and physical irrigation infrastructure.
The irrigation-time calculation became the bridge between technical complexity and practical usability: instead of asking users to interpret dozens of measurements, the product answers the question they need to act on.